


CARTO & Snowflake: Location Intelligence for Energy and Utilities
CARTO and Snowflake expanding cloud-native Location Intelligence for Energy and Utility organizations, unifying IoT data for resilient operations.


The Wall Street Journal's 2012 election map done with CartoDB
Discover the 2012 election map by WSJ, powered by CartoDB. Explore presidential and Senate races, filter data, and delve into economic indicators.
A trip back in time to 1940s in New York City
Explore 1940s New York through an interactive map showcasing local market analysis, color-coded maps, and photos. A fascinating glimpse into city life 70 years ago!
Data journalism & street reporting at The New York World
Explore NYC's stop-and-frisk hotspots in 2011. Data journalism meets street reporting with CartoDB. Discover insights now!
An analysis of the bike-share program in NYC
Explore the upcoming NYC bike-share program with our comprehensive guide and insights from Steven Romalewski.
Balloon Mapping at the NY office
Discover balloon mapping at CARTO's NY office, an eco-friendly approach to aerial imagery. Explore civic and environmental projects with CARTO.
CartoDB at the Open Government Partnership meeting
Discover how Vizzuality is leveraging CartoDB for impactful open government projects, presenting insights and innovations at the OGP conference in Brasilia, Brazil.
A Human Right project
Exciting news: CartoDB joins A Human Right in harnessing idle bandwidth for social causes like disaster relief and education.

Academy

3 ways Location Intelligence is changing outdoor advertising
See how leading OOH companies use cloud-native spatial analytics and AI to move beyond impression counts and prove campaign ROI.
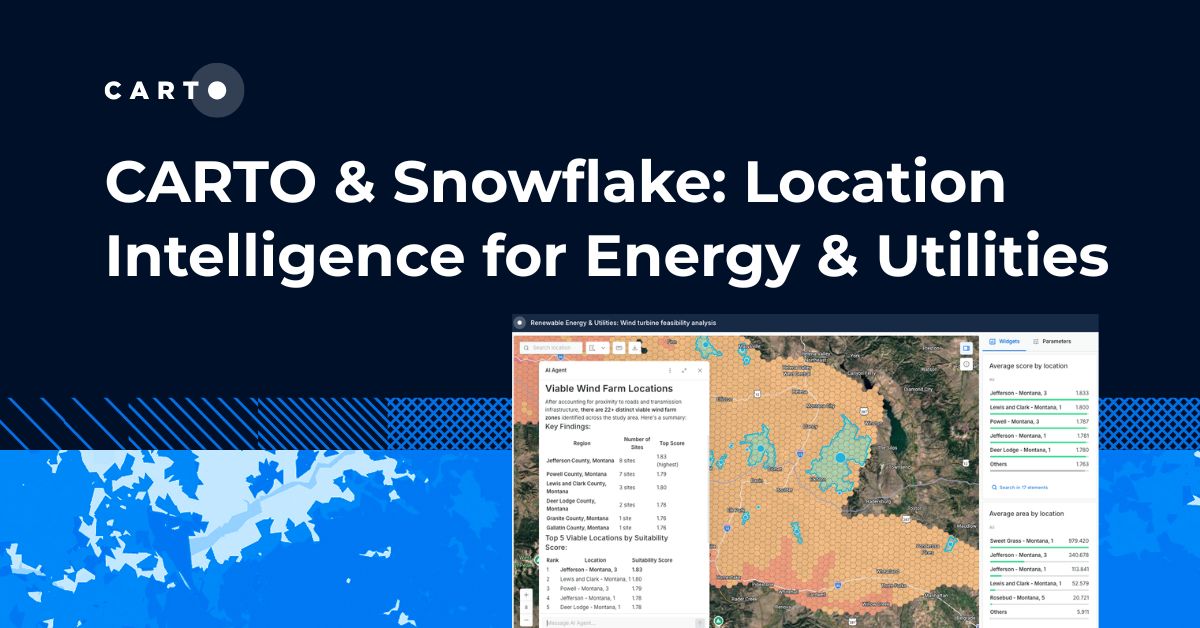
CARTO & Snowflake: Location Intelligence for Energy and Utilities
CARTO and Snowflake expanding cloud-native Location Intelligence for Energy and Utility organizations, unifying IoT data for resilient operations.

How to get your colleagues and clients excited about geospatial
A practical guide to building internal buy-in for geospatial, with tips on making the case to non-technical colleagues and leaders, speaking the right language.