Use cases
Telco dashboards: Turning accessible data into actionable insights
Discover how CARTO enhances data accessibility, empowering decision-makers with actionable insights to improve network access for senior citizens and communities.
Where Do Expats Invest in Property on the Spanish Coast?
See how idealista used geospatial analysis & real estate location data to uncover fascinating insights on coastal property demand in Spain
Using Location Intelligence to return to Valencian beaches
Play&go with the collaboration of dotGIS develops an app using CARTO's platform to ensure health & safety on the beaches of Valencia, Spain.
Building COVID-19 Dashboards with Google BigQuery
See how private & public sector organizations use Google Cloud Platform with CARTO to share insights & map visualizations relating to the coronavirus pandemic.
Retail Data Analytics: Social & Credit Card Data
Within Retail Data Analytics we combine social media & credit card data to see how retailers can gain key market insights, optimize footprints, & boost sales.
Google BigQuery Visualization: Mapping Big Spatial Data
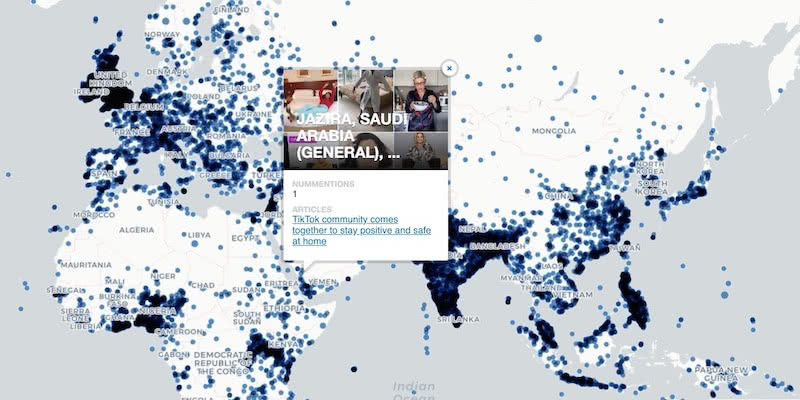
The GDELT Project describe how to use Google BigQuery to visualize their dataset of online news coverage focusing on COVID-19
Google Analytics Spatial Data Visualized with BigQuery
Our partner Liveli takes a look at how to visualize spatial data from Google Analytics using BigQuery, gaining deeper insights from website traffic.
Comparative Market Analysis Real Estate: Twin Areas
With many retailers consolidating stores & focusing on curbside pickup, comparative market analysis real estate can identify twin areas to maximize revenue.
What Geospatial Analysis tells us about Meatpacking & COVID-19
One of our partners, makepath, describe how to use multiple open source spatial libraries for COVID-19 analysis focusing on the US meatpacking industry.
Supply Chain Network Optimization: SEUR Case Study
A look at how Spatial Analysis & Location Data can provide the tools & techniques for Supply Chain Network Optimization
COVID-19 Inequality: A Focus on Brazil Coronavirus Maps
With Brazil Coronavirus cases soaring we take a look at the importance of using maps as an awareness tool to ensure an appropriate response.


Identifying Walk to Work Hotspots in London
We explore Howsy's research on walk to work rental hotspots across London, with consumers looking to ditch mass transit as they look to change their new normal commute.
US Protest Map & Visualizing Police Violence
Using Spatial Analysis to analyze & visualize Location Data relating to the recent protests & police violence in the US including a protest map.

Academy
Google Cloud Next 2025: Key takeaways for geospatial
Discover key geospatial insights from Google Cloud Next 2025 - AI, low-code tools, Earth Engine, and more innovations shaping the future of location tech.
Telco dashboards: Turning accessible data into actionable insights
Discover how CARTO enhances data accessibility, empowering decision-makers with actionable insights to improve network access for senior citizens and communities.
The first 5 maps everyone needs to make with CARTO
New to CARTO? Start with these 5 essential maps! Learn how to analyze proximity, work with big data, integrate real-time updates, and leverage AI-driven insights.


.jpg)


