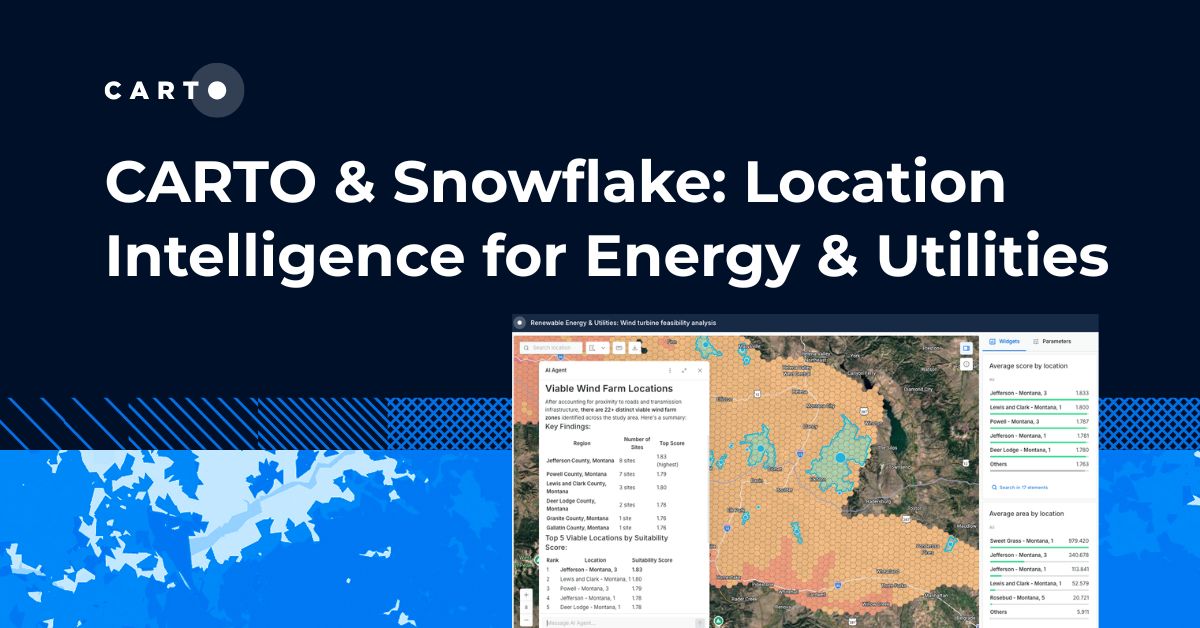


CARTO & Snowflake: Location Intelligence for Energy and Utilities
CARTO and Snowflake expanding cloud-native Location Intelligence for Energy and Utility organizations, unifying IoT data for resilient operations.


CartoDB Migration Complete, Welcome to 2.0
Explore CartoDB 2.0 migration: enhanced spatial data visualization, improved performance, upcoming features. Share your feedback with the community.
Things are moving fast in the mapping community #SOTMPDX
Explore the significant events of 2012 in the world of maps, from Google's charging to OpenStreetMap's rising influence. Exciting times ahead for online mapping
CartoDB backs your apps
CartoDB simplifies map-driven applications with tools like the Backbone library. Learn to leverage your data effectively online.
A round-up of maps build by CartoDB users
Discover projects from the US Dept. of Energy's Alternative Fueling Station Locator to Baltimore's Vacant Buildings map and Moscow's DIY traffic counter.
A Code for America's open city tool powered by CartoDB
Explore NeighborDiff by Code for America: a collaborative mapping tool reshaping Macon, GA, powered by CartoDB.
The Political Moneyball
Uncover the web of political contributions with WSJ's Political Moneyball, powered by CartoDB. Visualizing over a million connections in real-time.

Academy

3 ways Location Intelligence is changing outdoor advertising
See how leading OOH companies use cloud-native spatial analytics and AI to move beyond impression counts and prove campaign ROI.
CARTO & Snowflake: Location Intelligence for Energy and Utilities
CARTO and Snowflake expanding cloud-native Location Intelligence for Energy and Utility organizations, unifying IoT data for resilient operations.

How to get your colleagues and clients excited about geospatial
A practical guide to building internal buy-in for geospatial, with tips on making the case to non-technical colleagues and leaders, speaking the right language.