


.jpg)
Navigate consumer demand with NIQ Purchasing Power Data


.png)
Consumer markets are more competitive and fragmented than ever. Every growth decision - from where to open a store to how to target your marketing budget - depends on knowing not just who your customers are, but where they are, how much they can spend - and what they are willing to spend it on.
That’s exactly the challenge our latest data partnership helps you solve. Today, we’re excited to announce that NIQ Purchasing Power data is now available for subscription through the CARTO Data Observatory! With seamless access through your cloud data warehouse users always have access to the latest insights into consumer purchasing power - no ETL required.
NIQ Purchasing Power data shows how disposable income is distributed locally across countries, down to postcode or administrative area level. Recognized as the benchmark for assessing consumption potential, it enables precise evaluation of where opportunities exist.
The data quantifies how much income is allocated to specific product lines at the category level - helping businesses answer the critical question: what do people spend on, and where?
Unlike generic economic statistics, NIQ Purchasing Power is designed for business actionability. Its standardized methodology ensures comparability across regions, while its local-level granularity uncovers variations that drive smarter strategies.
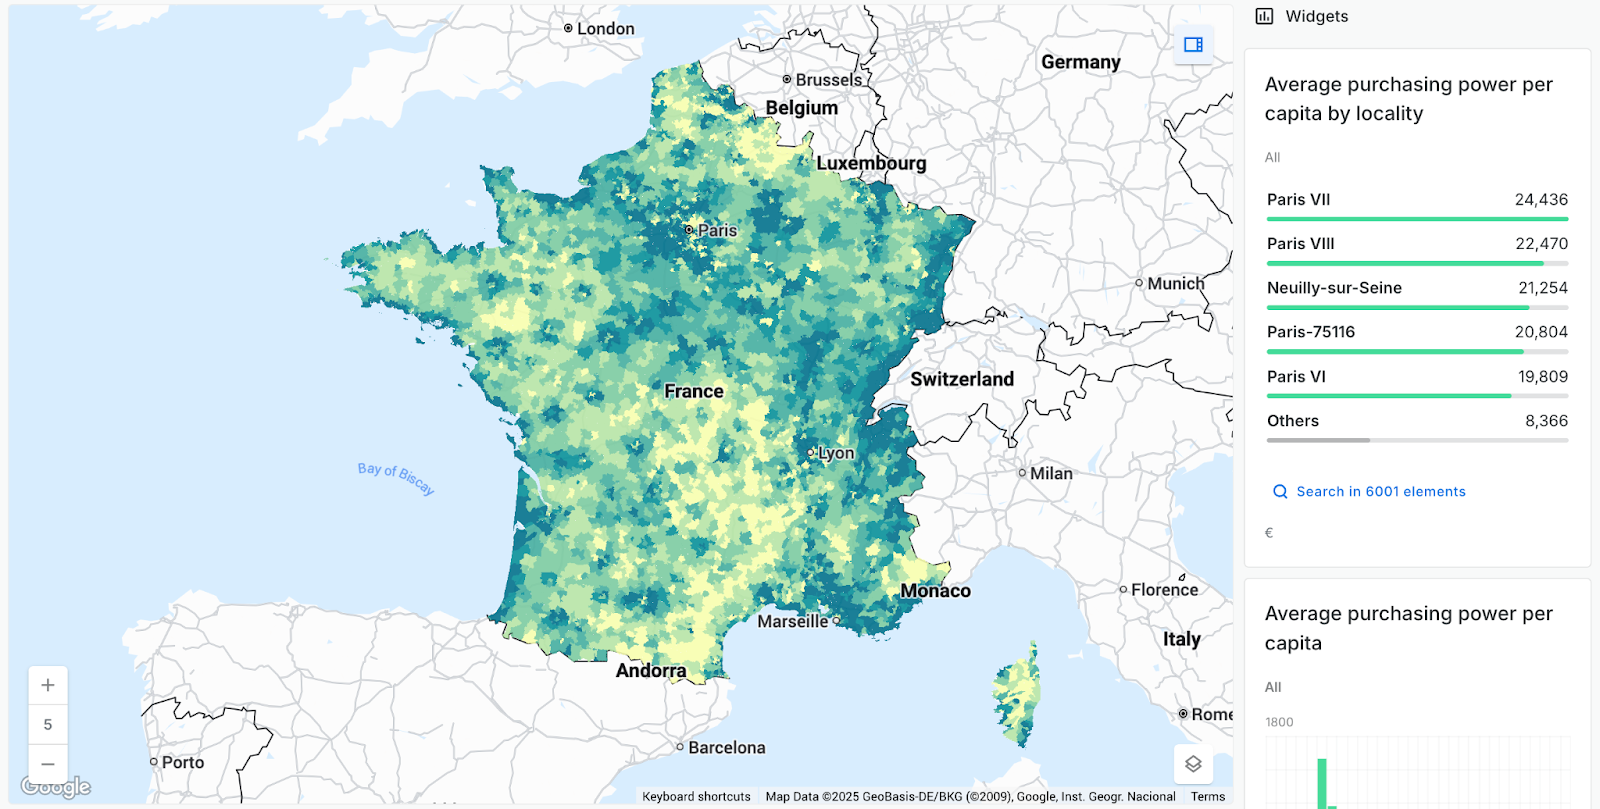
NIQ Purchasing Power for Retail Product Lines is an annual dataset that quantifies disposable income at the local level. It’s built on surveys and consumer behavior analyses, then modeled to regions - so you can see real differences in demand across different areas.
The dataset covers 16 key retail product categories, showing how much disposable income consumers allocate to each:
- Food and related items (food, alcohol-free beverages, alcoholic beverages, tobacco products)
- Health and hygiene products
- Clothing
- Shoes, leather goods
- Furnishings
- Household products, glass, porcelain
- Electrical household appliances
- Consumer electronics, information technology and photography
- Watches, jewelry
- Books, stationery
- Sporting goods, hobbies and recreation
- Home improvement items
Each value is provided as a nominal (non-inflation-adjusted) forecast, linked to the place of residence, and represents average per-inhabitant purchasing power.
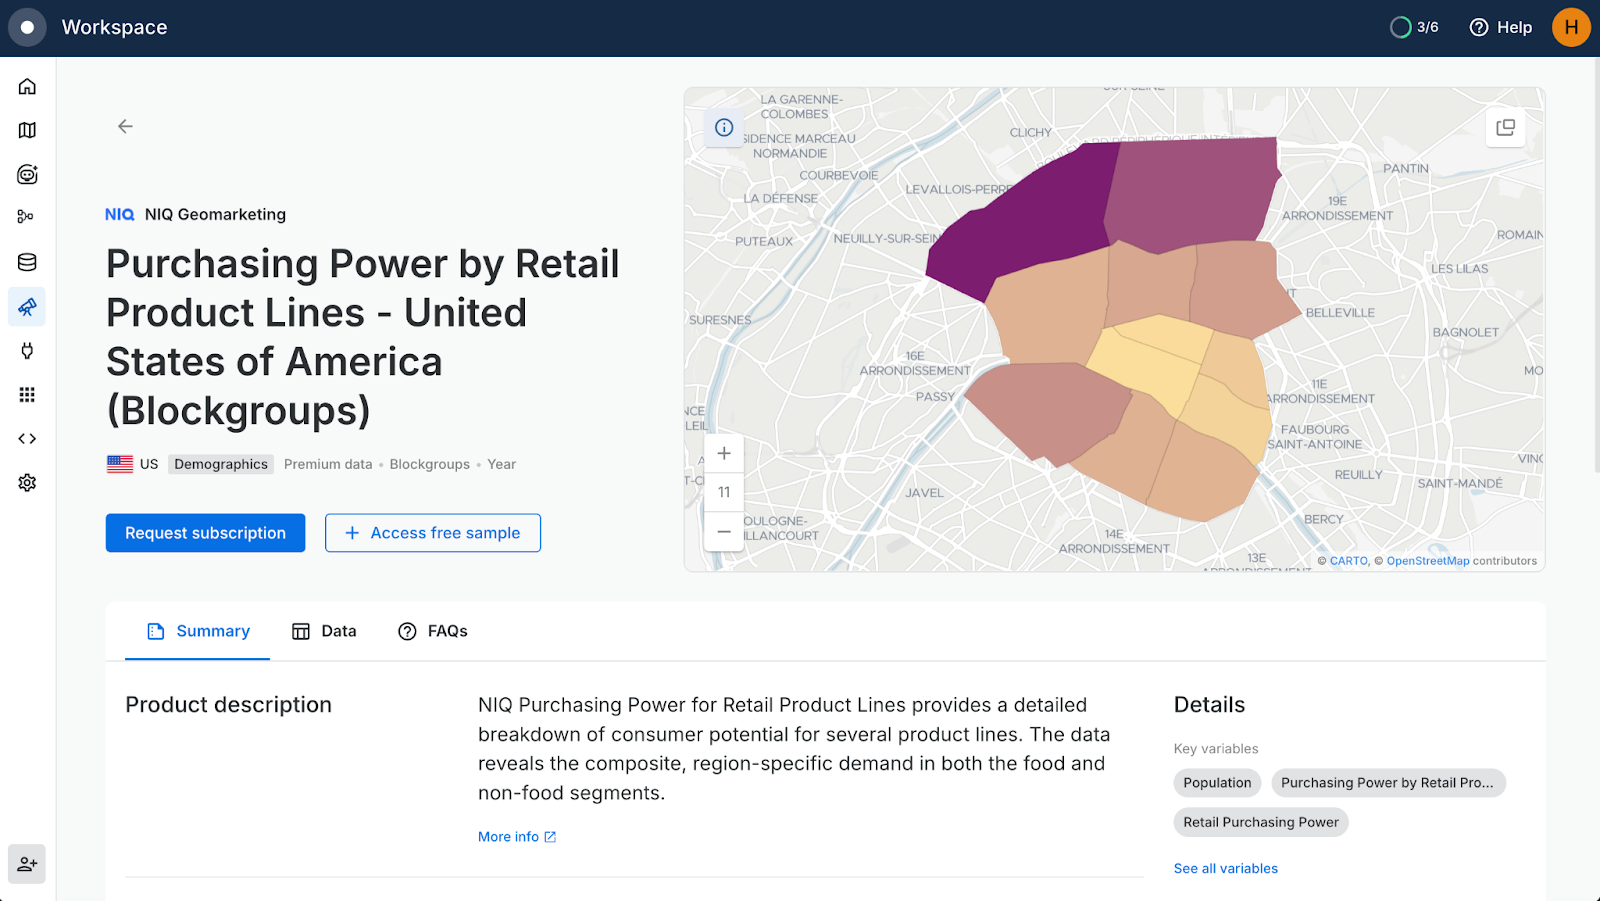
The data is available for a range of geographies - from countries and federal states down to districts, municipalities, and 5-digit postal codes - covering most of Europe, North America, and selected markets in Asia and South America.
NIQ Purchasing Power data gives organizations the intelligence needed to make smarter, more precise decisions. Some key applications include:
- Location Planning: Identify the best sites with confidence. NIQ Purchasing Power data shows how large a catchment area needs to be to meet turnover goals, ensuring products and services are placed only where consumers have the spending power to support them.
- Market Analysis: Quickly size up opportunities. By revealing disposable income, the dataset provides a clear window into the economic health of each region - helping to pinpoint turnover potential in minutes.
- Targeted Marketing: Build a 360° consumer view. Spot areas with high concentrations of potential buyers and focus campaigns where they’ll have the greatest impact.
- Location Enrichment: Enhance your own data. Combine consumer addresses, store locations, or sales territories with socioeconomic insights to better understand the characteristics of each market.
- Audience Segmentation: Reach the right consumers more efficiently. Concentrate marketing resources in regions with the highest potential to improve results, increase efficiency, and reduce wasted spend.
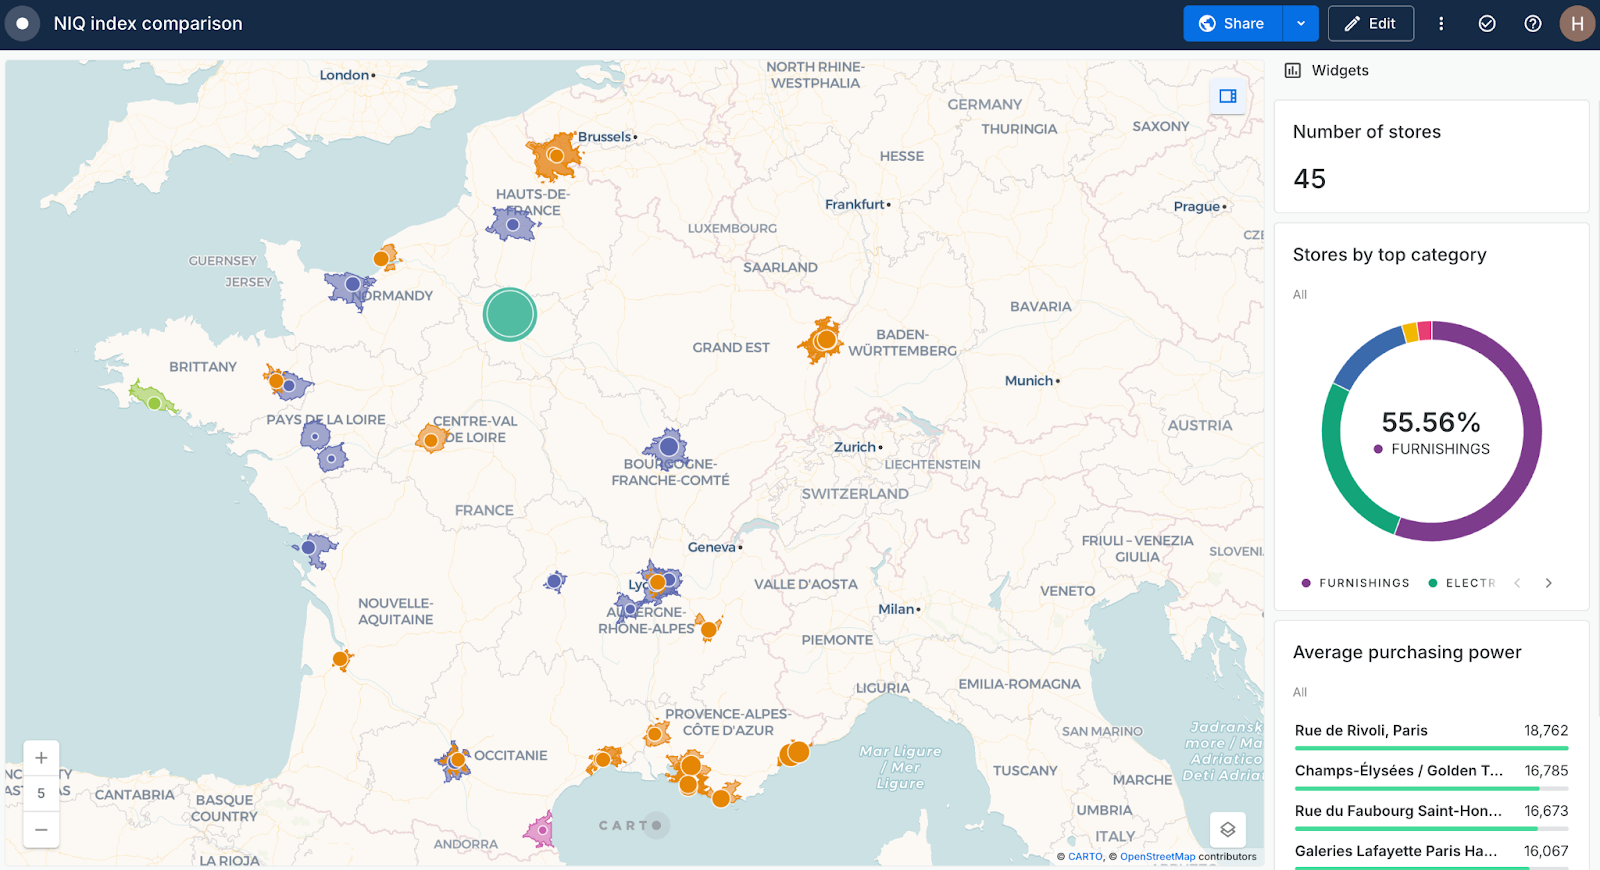
Here’s what this looks like in action: the interactive map below (open in full screen here) was built using NIQ Purchasing Power data to support a synthesized department store chain in France. This has been achieved by using CARTO Workflows to generate 30-minute travel-time isolines around each store and then enriching these with NIQ data.
The result? A clear picture of which categories should be prioritized at each location, so product mix and marketing can be tailored to real local demand.
Getting started with this data is simple! Sign in to the CARTO Workspace (you can sign up for a free 14-day trial here) and locate the datasets in the Data Observatory. Select Request Subscription (see below) and our team will help you explore your options - you can also access a sample of the data to try it out in the meantime!
Once subscribed, you’re ready to start using NIQ data to deliver real outcomes - straight from your data warehouse!
With competition for consumer attention at an all-time high, having access to accurate, timely, and actionable purchasing power insights is no longer optional - it’s essential. NIQ Purchasing Power Data enables organizations to locate demand, understand it, quantify it, and respond with confidence.
Ready to see what NIQ data can do for you? Request a demo today and discover how to fuel smarter growth strategies for your business.


.png)

.jpg)
.png)

.png)