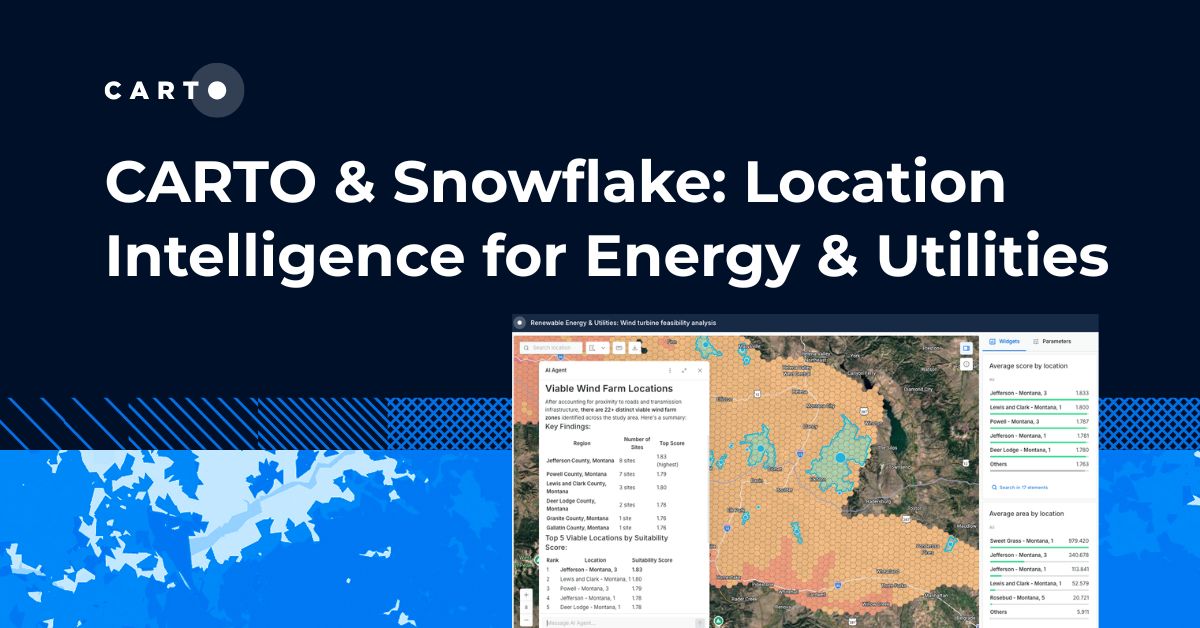


CARTO & Snowflake: Location Intelligence for Energy and Utilities
CARTO and Snowflake expanding cloud-native Location Intelligence for Energy and Utility organizations, unifying IoT data for resilient operations.


CartoDB the Data Analysis Technology for New Media
Elevate data journalism with CartoDB! Join us at Jornada de Periodismo de Datos conference. Explore workshops, webinars, and stay informed with our Geo-Jour Newsletter.
This year is no exception! CartoDB will be at FOSS4G-NA
Join CartoDB at FOSS4G-NA 2016 in Raleigh, NC, where our team will share insights on mapping, machine learning, and data analysis.
The L.A. Times scores a slam dunk with a data visualization of every shot Kobe’s made...ever!
Explore the LA Times' data-driven visualization, mapping every shot of Kobe Bryant's career using CARTO, highlighting his legacy through impactful data.
Tacking the Challenges of Humanitarian Mapping
Discover the power of mapping in humanitarian crisis response. See how CartoDB and the Humanitarian OpenStreetMap Team collaborate for effective relief efforts.
CartoDB Mobile with Xamarin
Join CartoDB at Xamarin Evolve 2016 in Orlando, FL, as we showcase our Nutiteq maps component for Xamarin developers. Write code once and run it everywhere!
CartoDB is going to Japan with Pacific Spatial and OSGeo Japan
Join CartoDB in Tokyo! Engage with our team, explore location intelligence, and connect at our events. Don't miss out!
CartoDB goes BIG!!!
The power of Big Data with CartoDB! Join us for a week of insights, webinars, and events. Discover how location intelligence can transform business decisions.
Improve your (musical) timing with CartoDB Time Isolines and derive the best data insights
Explore CartoDB's Time and Distance Isolines at SXSW, making tactical business planning easy. Measure pedestrian travel time between hotspots. Time is money!

Academy

3 ways Location Intelligence is changing outdoor advertising
See how leading OOH companies use cloud-native spatial analytics and AI to move beyond impression counts and prove campaign ROI.
CARTO & Snowflake: Location Intelligence for Energy and Utilities
CARTO and Snowflake expanding cloud-native Location Intelligence for Energy and Utility organizations, unifying IoT data for resilient operations.

How to get your colleagues and clients excited about geospatial
A practical guide to building internal buy-in for geospatial, with tips on making the case to non-technical colleagues and leaders, speaking the right language.