


Turning Geospatial Foundation Models into Decisions using CARTO Workflows


Over the past few years, machine learning models have redefined what’s possible in AI, powering breakthroughs in language understanding, computer vision, and scientific discovery. Geospatial data is now entering this same era of accelerated innovation, and CARTO is helping bring this shift into your everyday analytic workflows— making advanced spatial models accessible, operational, and usable directly where your data is saved.
Today, we're excited to introduce new capabilities in CARTO that let you run analytics directly on geospatial foundation model embeddings!
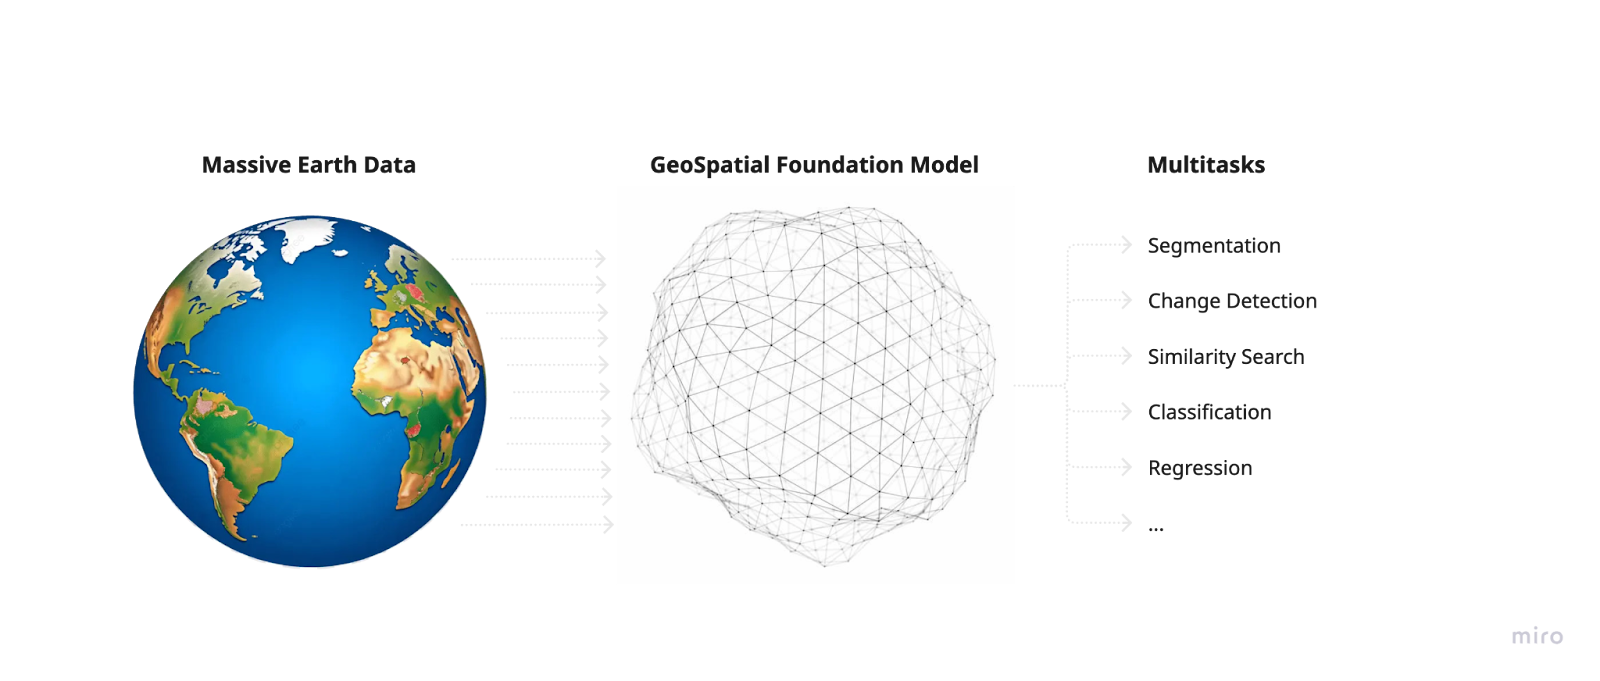
Unlike traditional models, which are usually built for a single purpose and depend on a small number of hand-selected datasets, foundation models (FM) are large AI models pre-trained on vast amounts of data that can be adapted to a broad range of tasks.
In the geospatial world, these foundation models are trained on diverse (usually multimodal) datasets like satellite imagery, maps, points of interest, and online behavior to understand the physical and human world.
By learning from this information, these foundation models generate a set of geo-embeddings: think of a digital fingerprint of a geographic location in compact vector representations (ex. list of numbers) that captures the full context of a place. A geo-embedding can encode different key details, such as:
- Satellite imagery: Is the area urban, rural, or forested?
- Infrastructure: Amenities, businesses, and services available.
- Text descriptions: Web search trends to identify interests, concerns, and needs of different communities.
- Sensor data: Temperature, humidity, and air quality.
While these embeddings are rich layers of information, the real power lies in how they reveal patterns and relationships within a location, uncovering trends that might otherwise remain hidden.
CARTO acts as a bridge between foundation model research and real-world analytics, making these powerful models accessible to everyone— not just ML or data science experts.
Through CARTO Workflows, complex AI models are transformed into user-friendly components. These are available in the Geospatial Foundation Models Extension Package: embeddings can be seamlessly integrated into the canvas via a simple drag-and-drop interface, and combined with your own business, environmental, or demographic datasets for more comprehensive analyses.
Running directly in your data warehouse (e.g., BigQuery), CARTO ensures scalable, reproducible workflows that let practitioners leverage foundation model embeddings without needing specialized machine learning expertise.
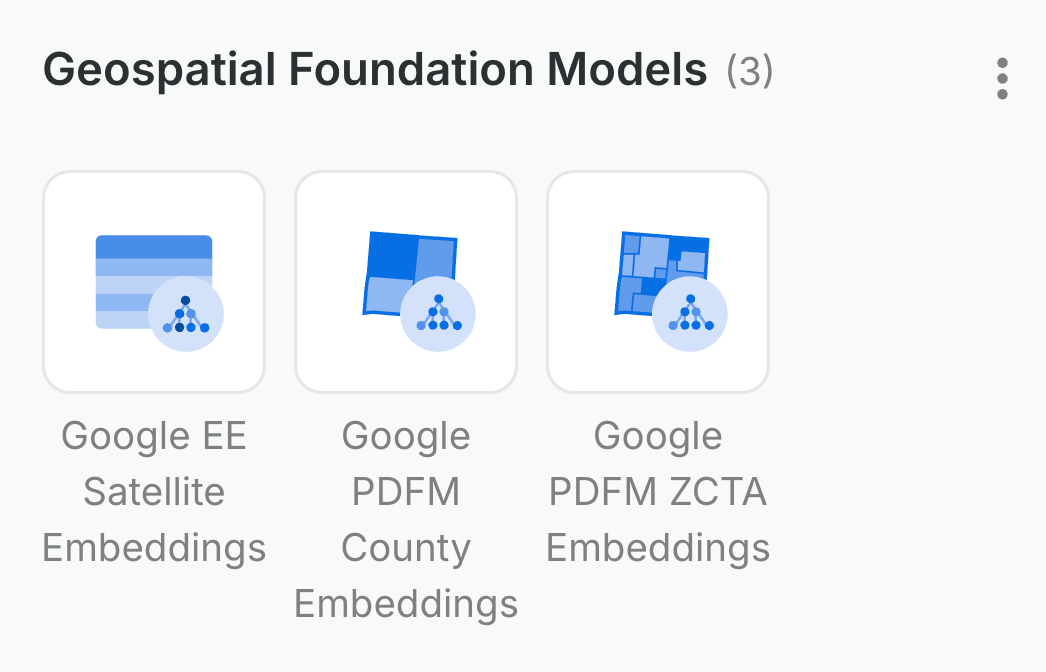
To learn more about the available embeddings, check out these two resources: Google’s Population Dynamics Foundation Models (PDFM) and AlphaEarth’s Satellite Embeddings.
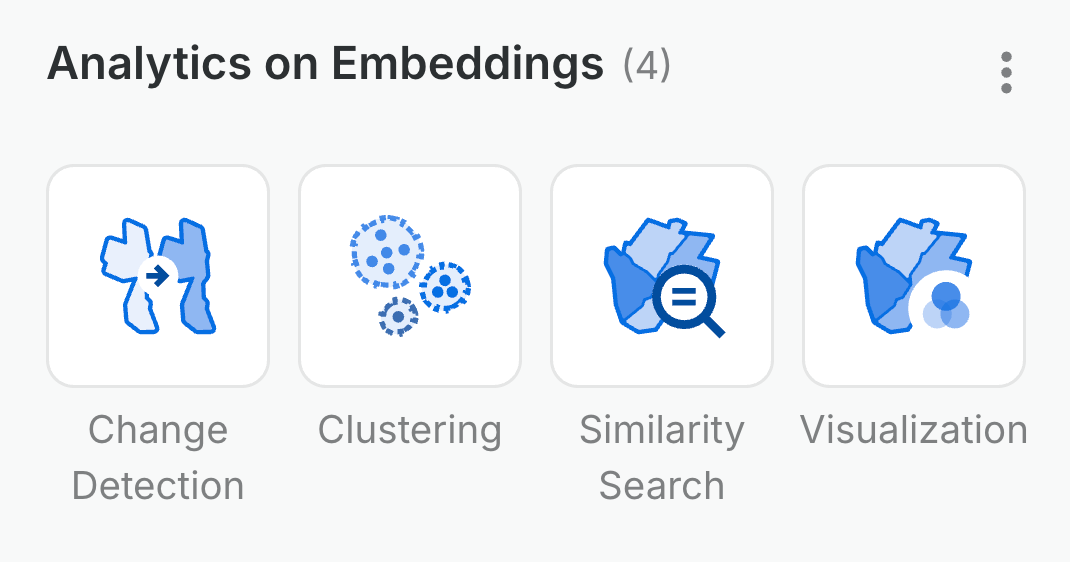
So, how can these geospatial embeddings help drive insights for your team and organization? Geo-embeddings translate complex spatial patterns into numerical vectors, making it easier to analyze, compare, and act on location-based information. CARTO’s new extension package for easy Analytics on Embeddings lets you:
- Visualize embeddings to reveal patterns hidden in complex spatial data
- Cluster locations based on latent spatial characteristics
- Identify similar places that behave alike
- Detect changes across temporal snapshots
In addition, you can incorporate embeddings into your Machine Learning workflows using the BigQuery ML Extension Package, leveraging them as powerful features to enhance analyses, detect spatial patterns, and reveal relationships across your data.
Now the foundation is set (no pun intended), let’s explore practical ways to leverage these embeddings, showing how these cutting-edge models can add value to real-world decisions across business, urban planning, and environmental applications.
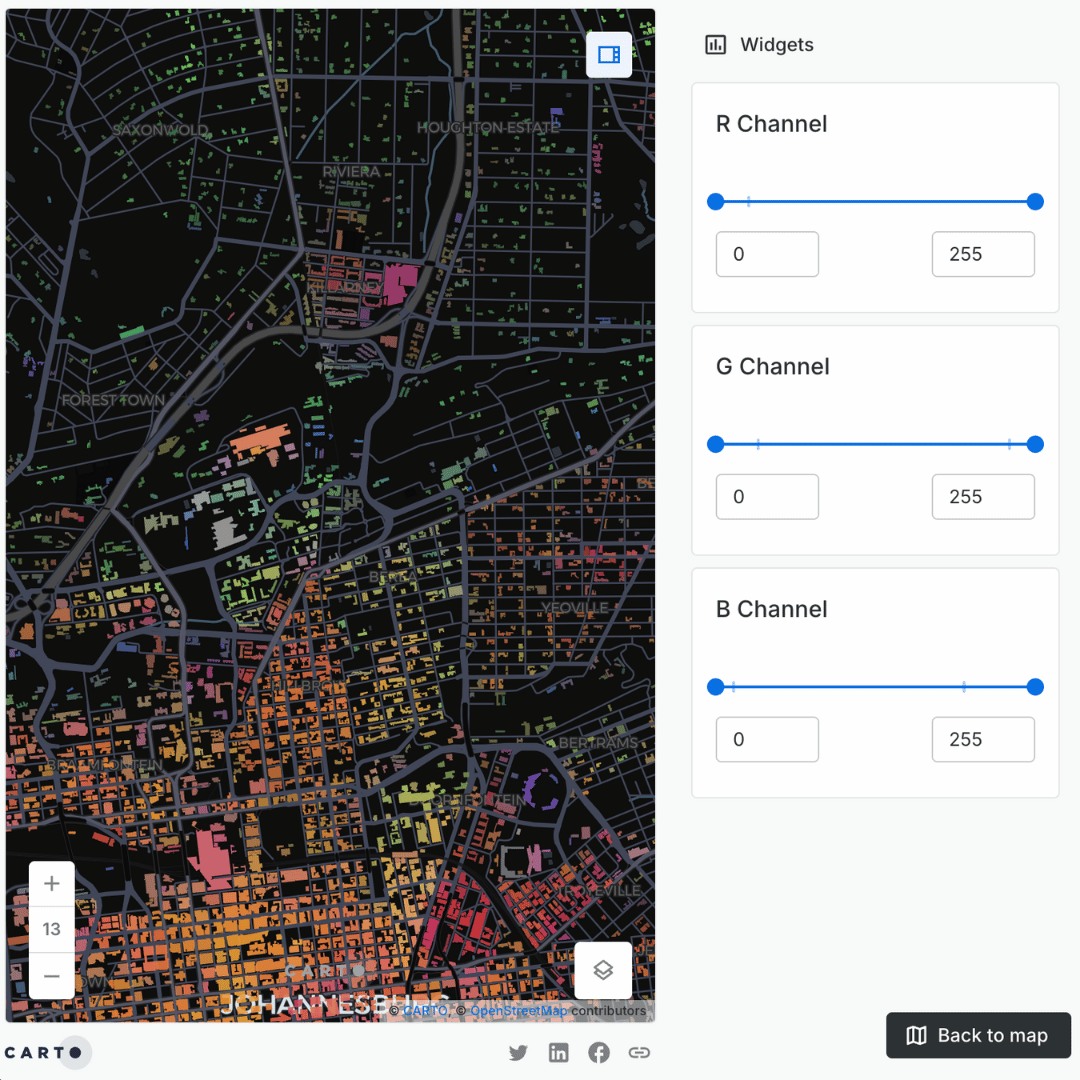
By visualizing geo-embeddings of urban areas, planners can have a very first intuitive spatial view of the urban built environment, guiding decisions on urban greening, infrastructure, and heat-mitigation strategies faster than traditional satellite imagery.
To demonstrate this, AlphaEarth’s Satellite Embeddings are visualized below for buildings within a particular region of South Africa. Using the Visualization component, a PCA-based RGB color was generated for fast and flexible visualization.
The resulting color patterns suggest that high concentration of red corresponds to high building density, green highlights areas with dense vegetation, and blue indicates industrial or commercial buildings with reflective roofs.
This geo-embedding thus quickly reveals building-density and land-cover patterns that are not apparent in raw satellite imagery – saving time without sacrificing scale or quality of data.
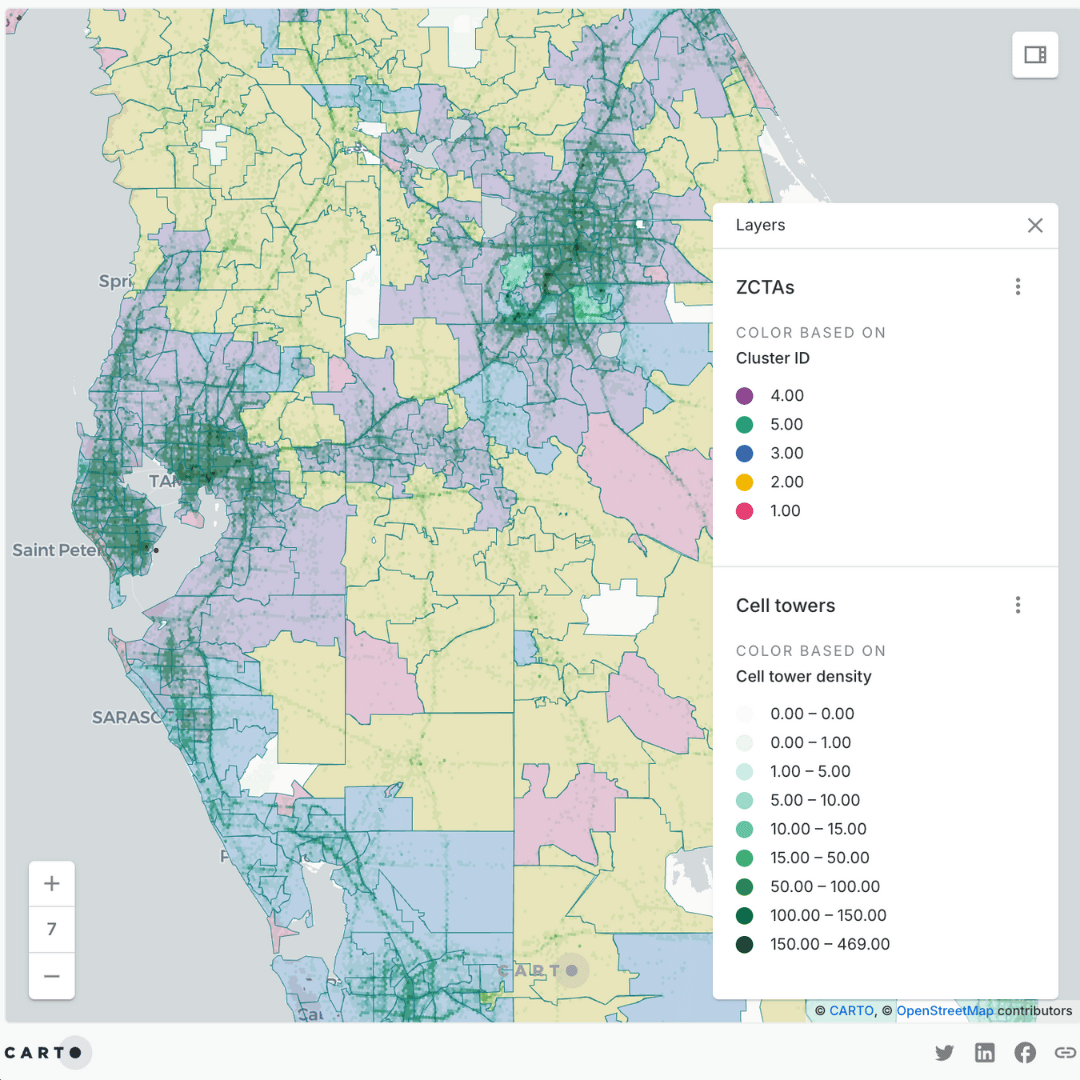
In addition, geo-embeddings are powerful tools to capture mobility patterns and environmental signals — key factors to identify areas with similar network demand characteristics. This can help telecom providers optimize the placement of cell towers or Wi-Fi hotspots and plan infrastructure upgrades more efficiently.
For example, using the Clustering component alongside Google’s ZCTAs PDFM Embeddings, organizations can quickly identify network and service gaps. By comparing areas clustered by similar mobility patterns and analyzing their cell-tower density, clear differences emerge:
- Clusters with rising mobility yet low tower density may indicate areas for potential upgrade opportunities.
- Clusters that are more stable may suggest a focus on maintenance and optimizations.
Leveraging clustering on geo-embeddings thus helps highlight service gaps and network patterns that are not immediately visible from raw data, allowing organizations to prioritize improvements and make data-driven decisions efficiently.
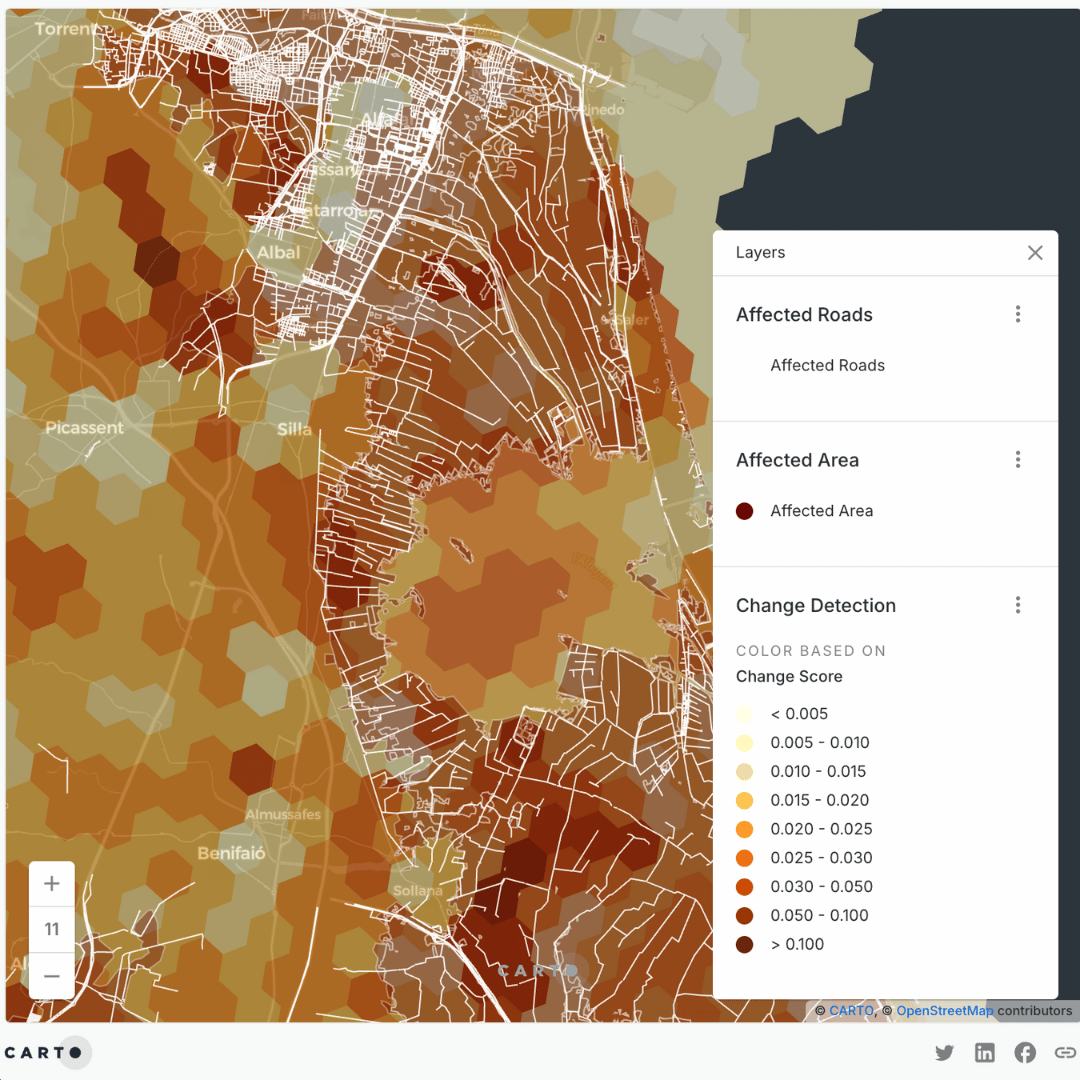
Detecting changes in land, environment, or population movements for risk analysis or streamlining underwriting becomes more precise using embeddings, as comparing vectors over time reveals subtle shifts that raw data may miss. This enables monitoring of urban growth, wildfire or flood impacts, water-level changes, tourism flows, and shifts in economic or social activity.
For the 2024 DANA floods in Valencia, Satellite Embeddings from 2023 can be directly contrasted with embeddings generated in 2024 to quantify how much each location changed in high-dimensional feature space. Using the Change Detection component, we can signal areas where flooding altered terrain, damaged infrastructure, or stressed vegetation to identify regions that may require targeted intervention or continued observation.
Interestingly, the algorithm also highlights regions not impacted by the DANA floods since it detects any significant change between the two years— such as seasonal vegetation shifts, or ongoing urban development.
This broader detection unlocks temporal insights and ensures that analysts can contextualize storm impacts, improving the accuracy of assessments that drive business decisions.
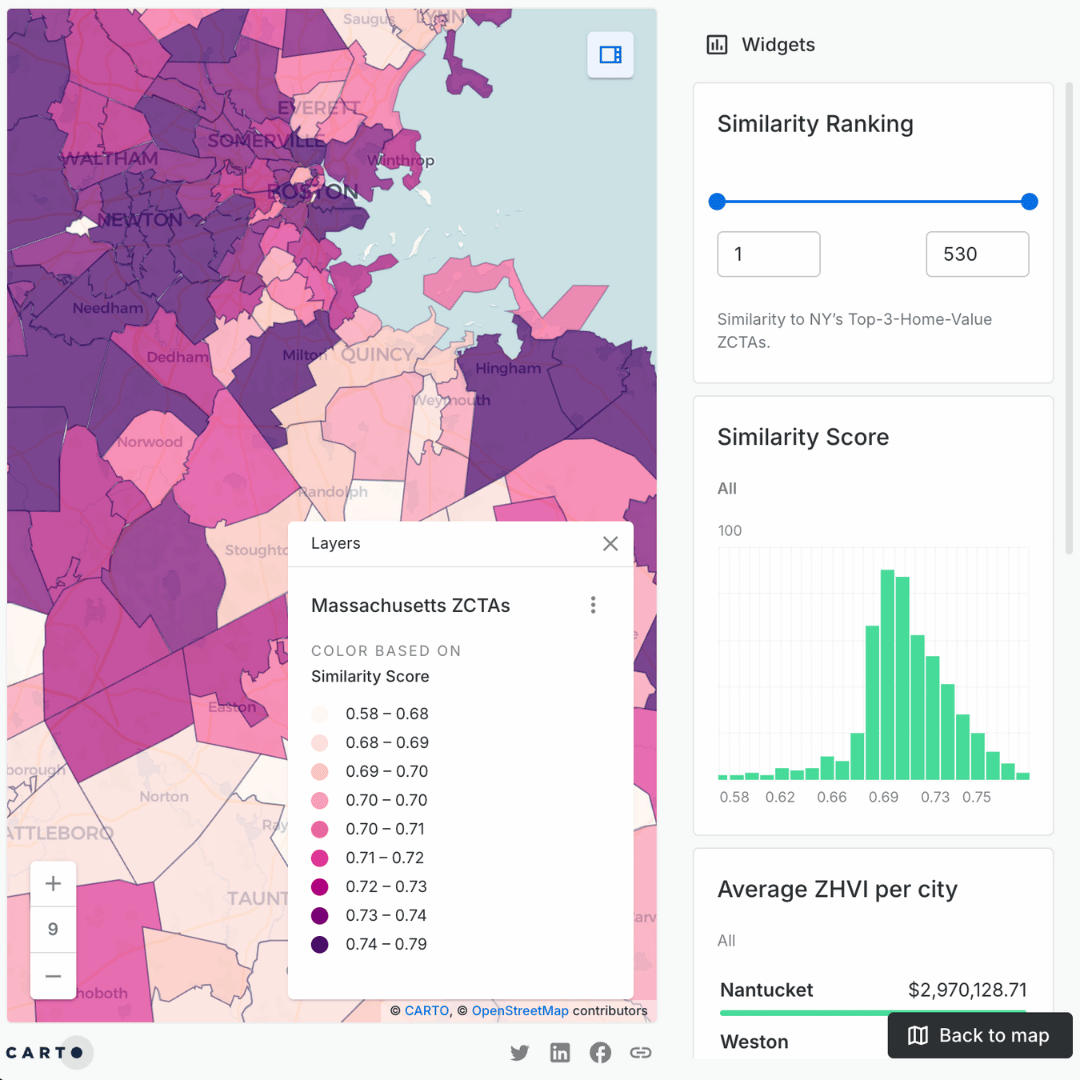
Need to quickly identify neighborhoods, land parcels, or regions with similar characteristics? This is key for many industries and real estate is no exception. Geo-embeddings can be used to suggest areas for investment, pricing, or expansion based on “similar zip code profiles,” taking into account multiple socio-economic factors rather than relying solely on location or median income, unlocking more multidimensional insights for decisions.
To put this to the test, we applied the Similarity Search component using ZCTAs PDFMs to analyze high-value locations across states. Our goal was to find comparable locations in Massachusetts with the three most valuable ZCTAs in New York—based on Zillow’s House Value Index, which are located within Suffolk County, a well-known, wealthy, and highly desirable real estate market, with luxury coastal properties in the Hamptons attracting affluent buyers and investors.
As we see below, the algorithm consistently highlighted Massachusetts’s wealthiest regions as most similar, like Nantucket, Norfolk, or Essex, capturing areas with lower unemployment rates and similar socio-economic dynamics.
By leveraging geo-embedding-based similarity tools, investors and developers can quickly spot the best opportunities, comparing markets with precision and confidence.
Lastly, Foundation Models can also be used as powerful feature extractors, generating embeddings that can then feed into traditional machine-learning workflows— such as regression, classification, or forecasting— alongside other geospatial and non-spatial variables.
In this wildfire-risk example, AlphaEarth’s Satellite Embeddings are combined with historical burn records from the Wildland Fire Interagency Geospatial Services open data portal to build a predictive model. We used data from 2021-2023 to estimate wildfire probabilities for 2024 by training a Random Forest classifier with BigQuery ML’s Extension Package using these embeddings as features. The resulting model predicts the probability that each grid cell will burn in 2024, leveraging the spatial patterns captured by the foundation-model embeddings to improve accuracy and scalability across large regions.
The model effectively captures risk in remote, vegetated, and dry areas. On evaluation, the areas that actually burned in 2024 had, on average, a 10% higher risk index compared to the rest of the state. These insights are valuable in helping organizations assess risk and influence disaster preparedness and mitigation plans.

If you want to take a closer look at this example, you can access the full live webinar with Google AlphaEarth here!
Embedding-based analytics in CARTO lets us uncover patterns in geospatial data that were previously hidden, revealing relationships, clusters, and anomalies that traditional methods may overlook. It’s all about helping organizations, planners, businesses, and researchers make smarter, more informed decisions.


.jpg)

.png)
