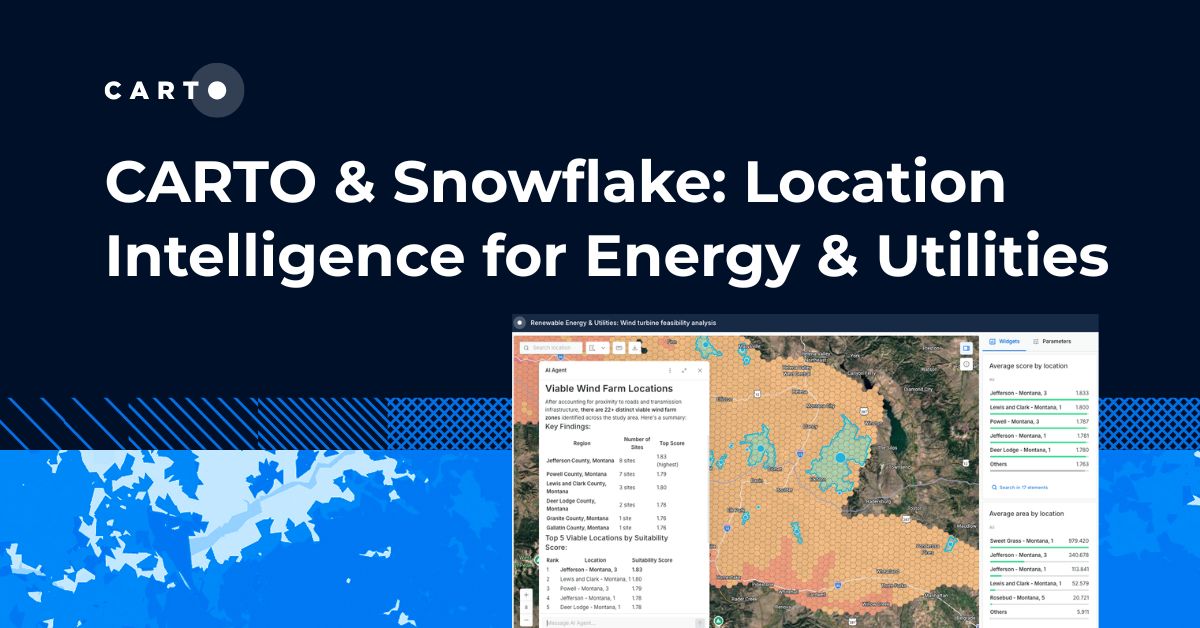
6 best practices for adopting AI in Spatial Analytics

6 best practices for adopting AI in Spatial Analytics

Learn 6 best practices for integrating AI into spatial analytics. Establish a secure, scalable AI strategy to automate tasks and make confident decisions.

Spatial Analytics

In your cloud

News

What’s New in CARTO - Q2 2025

Use cases

Create your expansion strategy with CARTO and Snowflake

CartoDB backs your apps

CartoDB backs your apps

CartoDB simplifies map-driven applications with tools like the Backbone library. Learn to leverage your data effectively online.

App Development
A round-up of maps build by CartoDB users

A round-up of maps build by CartoDB users

Discover projects from the US Dept. of Energy's Alternative Fueling Station Locator to Baltimore's Vacant Buildings map and Moscow's DIY traffic counter.

Customer Stories
A Code for America's open city tool powered by CartoDB

A Code for America's open city tool powered by CartoDB

Explore NeighborDiff by Code for America: a collaborative mapping tool reshaping Macon, GA, powered by CartoDB.

Cartography & Visualization
Our first collaboration with The Guardian, a time lapse map of Syrian casualties

Our first collaboration with The Guardian, a time lapse map of Syrian casualties

Use cases
The Political Moneyball

The Political Moneyball

Uncover the web of political contributions with WSJ's Political Moneyball, powered by CartoDB. Visualizing over a million connections in real-time.

News
Meet us at the International Open Government Data Conference

Meet us at the International Open Government Data Conference

Events
The Wall Street Journal's 2012 election map done with CartoDB

The Wall Street Journal's 2012 election map done with CartoDB

Discover the 2012 election map by WSJ, powered by CartoDB. Explore presidential and Senate races, filter data, and delve into economic indicators.

Cartography & Visualization
A trip back in time to 1940s in New York City

A trip back in time to 1940s in New York City

Explore 1940s New York through an interactive map showcasing local market analysis, color-coded maps, and photos. A fascinating glimpse into city life 70 years ago!

Cartography & Visualization
Data journalism & street reporting at The New York World

Data journalism & street reporting at The New York World

Explore NYC's stop-and-frisk hotspots in 2011. Data journalism meets street reporting with CartoDB. Discover insights now!

Cartography & Visualization
An analysis of the bike-share program in NYC

An analysis of the bike-share program in NYC

Explore the upcoming NYC bike-share program with our comprehensive guide and insights from Steven Romalewski.

Cartography & Visualization
Balloon Mapping at the NY office

Balloon Mapping at the NY office

Discover balloon mapping at CARTO's NY office, an eco-friendly approach to aerial imagery. Explore civic and environmental projects with CARTO.

Cartography & Visualization
Congratulations Scene Near Me! filming locations in NYC

Congratulations Scene Near Me! filming locations in NYC

News

Academy

6 best practices for adopting AI in Spatial Analytics

Learn 6 best practices for integrating AI into spatial analytics. Establish a secure, scalable AI strategy to automate tasks and make confident decisions.

Spatial Analytics

Branch out: new control components for more resilient workflows

Discover CARTO Workflows’ new Conditional & Success/Error Split components to build flexible, resilient spatial analysis pipelines.

Spatial Analytics

From Imagery to Insight: Google AlphaEarth Foundations in CARTO

Discover how CARTO integrates Google DeepMind’s AlphaEarth satellite embeddings for advanced geospatial AI, climate, and risk analysis.

Spatial Data Science