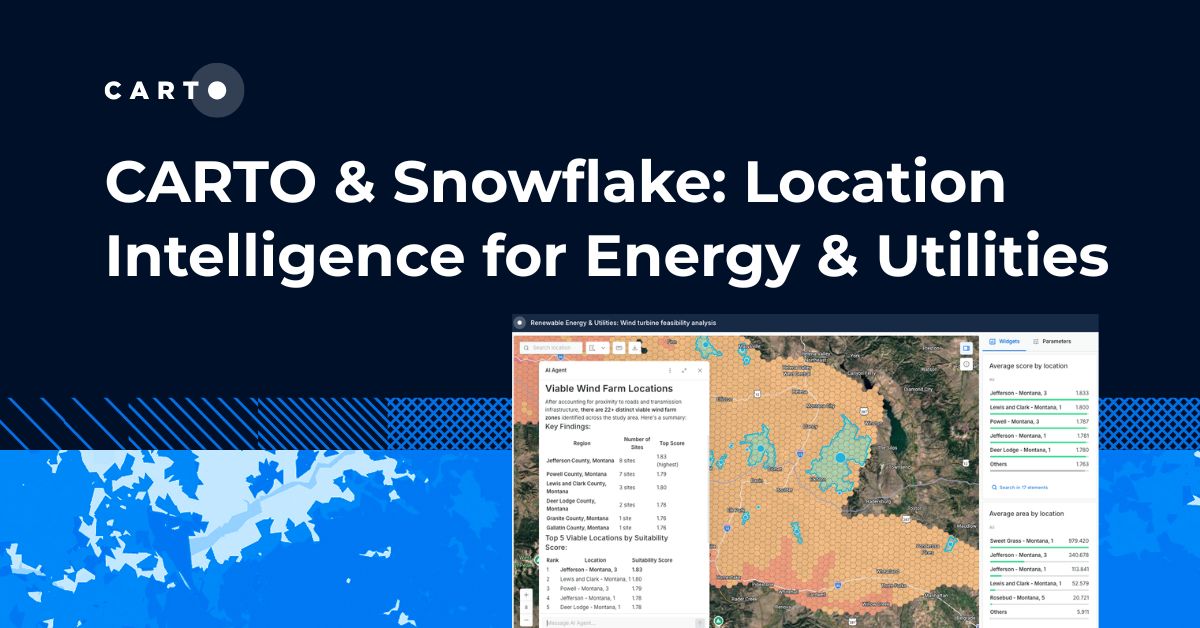


CARTO & Snowflake: Location Intelligence for Energy and Utilities
CARTO and Snowflake expanding cloud-native Location Intelligence for Energy and Utility organizations, unifying IoT data for resilient operations.


Can you hear me now? How Crowdx is Changing Telecos Big Data Analytics
Transforming telecommunications analytics with CartoDB! Learn how Crowdx analyzes millions of data points to enhance solutions for cellular network issues.

The L Train closure—what data can tell us
Discover insights from NYC's L Train closure analysis. Explore how data visualization reveals transit trends, community impacts, and planning solutions.
Time’s Running Out! Voting for FOSS4G-NA 2016
Vote for CartoDB's sessions at FOSS4G-NA 2016! Explore Python, Urban Scratchoff, Big Metadata, Information Commons, Decision Making Data, and Dynamic Maps.

Academy
CARTO & Snowflake: Location Intelligence for Energy and Utilities
CARTO and Snowflake expanding cloud-native Location Intelligence for Energy and Utility organizations, unifying IoT data for resilient operations.
Nagarro & CARTO: Advancing Enterprise AI Transformation
CARTO and Nagarro partner to help enterprises move AI from pilots to production, embedding Location Intelligence into existing workflows and systems.


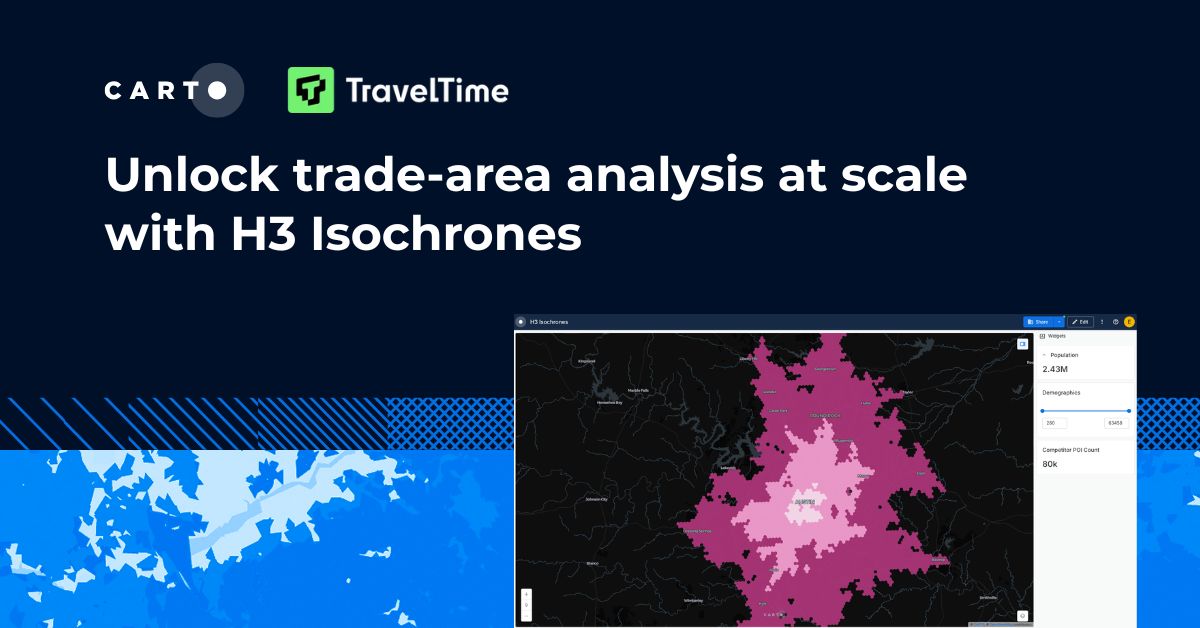
Unlock trade-area analysis at scale with H3 Isochrones
Scale travel-time analysis with H3-based isochrones in CARTO. Faster joins, overlap insights, and 96–99% time savings powered by TravelTime.